Fire Danger
Fire Danger marcella.muncyFire Danger Background
Fire Danger Background Anonymous (not verified)- General References
- 78/88 Version NFDRS Structure
- 2016 Version NFDRS Structure
- NFDRS Version Comparison
General References
Fire Danger ratings are an effective part of daily risk rating and operational preparedness for fire management agencies across the world. Chapter 10 – Preparedness of the Interagency Standards for Fire and Fire Aviation Operations outlines processes and resources applied in the development of standard Fire Danger Operating Plans in the United States.
Included in Fire Danger Operating Plans are:
- Specification of fire danger ratings.
- Identification of climatological thresholds for administrative purposes. Default thresholds include the 90th and 97th percentile values for key indices in the applied system. The Bureau of Land Management (Department of Interior) uses the 80th and 95th percentiles instead.
- Communication of those danger ratings, including both internal and external forms.
Some valuable links:
- Weather Information Management System (WIMS)
- Wildland Fire Assessment System (WFAS)
- NFDRS Pocket Cards
- National Interagency Coordination Center Predictive Services
A variety of fire weather systems are applied in danger rating around the United States. There are primarily two systems used in fire danger operating plans.
U.S. National Fire Danger Rating System (NFDRS):
First introduced in 1964, NFDRS has been updated in 1972, 1978, 1988, and now 2016 to integrate newer science and improved processing. This guide will compare important aspects of the 1978, 1988, and 2016 versions, detail important outputs, and describe primary components and indices. More information about the system and the latest update to it can be found at:
NWCG Fire Danger Subcommittee Website
The Canadian Forest Fire Danger Rating System (CFFDRS) Fire Weather Index (FWI) System
CFFDRS was introduced in Canada in 1970. Implemented in Alaska and the lake states of Michigan, Minnesota, and Wisconsin in the early 1990's. Details about CFFDRS are included a separate section of this guide. The following websites provide data access:
- Alaska and Great Lakes FWI
Other tools, formulations, and applications are used locally across the country. Some examples are highlighted later, in the Fire Danger References Section.
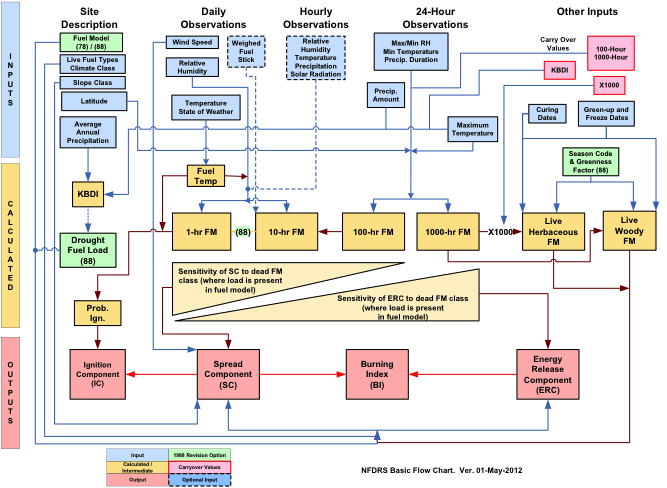
78/88 Version NFDRS Structure
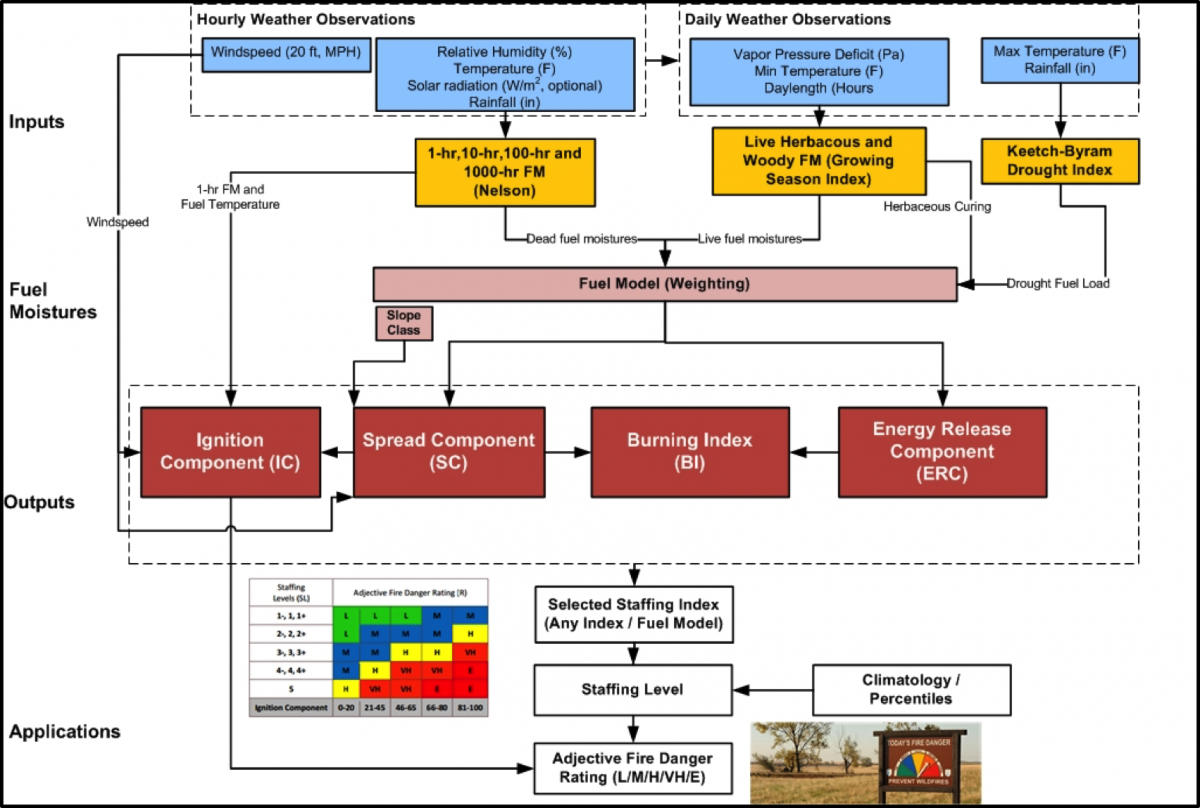
2016 Version NFDRS Structure
NFDRS Version Comparison
| Category | 78 Version | 88 Version | 2016 Version |
|---|---|---|---|
| Fuel Models and Settings |
|
|
|
| Climate Class |
|
|
|
| Manual Inputs |
|
|
|
| 1 hour & 10 hour | Fosberg-71 Model | Fosberg-71 Model | Nelson Model |
| 100 hour & 1000 hour | Fosberg-71 Model | Fosberg-71 Model | Nelson Model |
| Herbaceous and Woody Fuel Moisture Content | Herb fuels classified as dead when dormant. Transition from dormant/deal fuel moisture to live/full green-up based on climate class in spring 1000 hour based live moisture trend and load transfer |
Herb fuels classified as dead when dormant. Season/Greenness factor based live fuel moisture trend/load transfer unless fuels declared dormant. |
Herb fuels classed as dead when dormant. Green Season/Live Fuel Index based moisture trend and load transfer.
|
| Drought Fuel Load Transfer | KBDI used to signal initiation and amount of fuel load transfer. | KBDI used to signal initiation and amount of fuel load transfer. | |
| SC, IC, ERC, BI | Models unchanged. Outputs will vary based on differences from new fuel moisture models and new fuel model definitions. |
Models unchanged. Outputs will vary based on differences from new fuel moisture models and new fuel model definitions. |
Models unchanged. Outputs will vary based on differences from new fuel moisture models and new fuel model definitions. |
Fire Danger: NFDRS Station Catalog Site Settings
Fire Danger: NFDRS Station Catalog Site Settings Anonymous (not verified)- NFDRS Fuel Models
- Crosswalk between 2016 and 78/88 Version Fuel Models
- 78/88/16 NFDRS Fuel Model Definitions
- NFDRS Grass Fuel Model Descriptions
- NFDRS Grass/Shrub Fuel Model Descriptions
- Timber Understory and Timber Litter Fuel Model Descriptions
- NFDRS Brush/Shrub Fuel Model Descriptions
- NFDRS Slash and Blowdown Fuel Model Descriptions
- Annual vs Perennial Grass
- Deciduous vs Evergreen Shrub (88 Version only)
- Climate Class Assumptions (78/88 Versions only)
- Slope Class Setting
NFDRS Fuel Models
Crosswalk Between 2016 and 78/88 Version Fuel Models
| Carrier Fuel Category | NFDRS 2016 Fuel Model | Equivalent NFDRS 78/88 Fuel Model |
|---|---|---|
| Grass | V | A, L, T |
| Grass / Shrub | W | C, D, R, S |
| Brush | X | B, F |
| Forest | Y | G, H, N, P, O, Q, U, E |
| Slash | Z | I, J, K |
78/88/16 NFDRS Fuel Model Definitions (*1988 Version Fuel Model Revisions)
| Carrier | Fuel Model | Fuel Model Name | 1 hour Load t/ac | 10 hours Load t/ac | 100 hours Load t/ac | 1000 hours Load t/ac | Herb Load t/ac | Woody Load t/ac | Drought Load t/ac | 1 hour SAV | Herb SAV | Woody SAV | Bed Depth ft | Moist Extinct | Heat Cntnt btu/lb |
|---|---|---|---|---|---|---|---|---|---|---|---|---|---|---|---|
| GR | A | Western Annual Grasses | 0.2 | -- | -- | -- | 0.3 | -- | 0.2 | 3000 | 3000 | -- | 0.8 | 15 | 8000 |
| GR | L | Western Perennial Grasses | 0.25 | -- | -- | -- | 0.5 | -- | 0.25 | 2000 | 2000 | -- | 1.0 | 15 | 8000 |
| GR | V | 2016 Grass | 0.1 | -- | -- | -- | 1.0 | -- | 0 | 2000 | 2000 | -- | 1.0 | 15 | 8000 |
| GS | C* | Pine Grass Savanna | 0.4 | 1.0 | -- | -- | 0.8 | 0.5 (*0.8) | 1.8 | 2000 | 2500 | 1500 | 0.75 | 20 | 8000 |
| GS | N* | Sawgrass | 1.5 | 1.5 | -- | -- | -- | 2.0 | 2.0 | 1600 | -- | 1500 | 3.0 | 25 (*40) | 8700 |
| GS | S | Tundra | 0.5 | 0.5 | 0.5 | 0.5 | 0.5 | 0.5 | 1.5 | 2500 | 1500 | 1200 | 0.4 | 25 | 8000 |
| GS | T | Sagebrush Grass | 1.0 | 0.5 | -- | -- | 0.5 | 2.5 | 1.0 | 2500 | 2000 | 1500 | 1.25 | 15 | 8000 |
| GS | W | 2016 Grass/Shrub | 0.5 | 0.5 | -- | -- | 0.6 | 1.0 | 1.0 | 2000 | 2000 | 1500 | 1.5 | 15 | 8000 |
| SH | B | California Mixed Chaparral | 3.5 | 4.0 | 0.5 | 00 | 00 | 11.5 | 3.5 | 700 | 00 | 1250 | 4.5 | 15 | 9500 |
| SH | O | High Pocosin | 2.0 | 3.0 | 3.0 | 2.0 | -- | 7.0 | 3.5 | 1500 | -- | 1500 | 4.0 | 30 | 9000 |
| SH | F | Intermediate Brush | 2.5 | 2.0 | 1.5 | -- | -- | 9.0 | 2.5 | 700 | -- | 1250 | 4.5 | 15 | 9500 |
| SH | Q | Alaskan Black Spruce | 2.0 | 2.5 | 2.0 | 1.0 | 0.5 | 4.0 | 3.5 | 1500 | 1500 | 1200 | 3.0 | 25 | 8000 |
| SH | D | Southern Rough | 2.0 | 0.5 | -- | -- | 0.75 | 3.0 | 1.5 | 1250 | 1500 | 1500 | 2.0 | 30 | 9000 |
| SH | X | 2016 Shrub/Brush | 4.5 | 2.45 | -- | -- | 1.55 | 7.0 | 2.5 | 2000 | 2000 | 1500 | 4.4 | 25 | 8000 |
| TU/L | H | Short Needle Pine (Normal Dead) | 1.5 | 1.0 | 2.0 | 2.0 | 0.5 | 0.5 | 2.0 | 2000 | 2000 | 1500 | 0.3 | 20 | 8000 |
| TU/L | G | Short Needle Pine (Heavy Dead) | 2.5 | 2.0 | 5.0 | 12.0 | 0.5 | 0.5 | 5.0 | 2000 | 2000 | 1500 | 1.0 | 25 | 8000 |
| TU/L | E* | Winter Hardwoods | 1.5 (*1.0) | 2.0 | 0.25 | -- | 0.5 (*1.0) | 0.5 | 1.5 | 2000 | 2000 | 1500 | 4.0* | 25 | 8000 |
| TU/L | R | Summer Hardwoods | 0.5 | 0.5 | 0.5 | -- | 0.5 | 0.5 | 0.5 | 1500 | 2000 | 1500 | 0.25 | 25 | 8000 |
| TU/L | U | Western Long Needle Conifer | 1.5 | 1.5 | 1.0 | -- | 0.5 | 0.5 | 2.0 | 1750 | 2000 | 1500 | 0.5 | 20 | 8000 |
| TU/L | P | Southern Pine Plantation | 1.0 | 1.0 | 0.5 | -- | 0.5 | 0.5 | 1.0 | 1750 | 2000 | 1500 | 0.4 | 30 | 8000 |
| TU/L | Y | 2016 Forest | 2.5 | 2.2 | 3.6 | 10.16 | -- | -- | 5.0 | 2000 | -- | -- | 0.6 | 25 | 8000 |
| SB | K | Light Logging Slash | 2.5 | 2.5 | 2.0 | 2.5 | -- | -- | 2.5 | 1500 | -- | -- | 0.6 | 25 | 8000 |
| SB | J | Intermediate Logging Slash | 7.0 | 70 | 6.0 | 5.5 | -- | -- | 7.0 | 1500 | -- | -- | 1.3 | 25 | 8000 |
| SB | I | Heavy Logging Slash | 12.0 | 12.0 | 10.0 | 12.0 | -- | -- | 12.0 | 1500 | -- | -- | 2.0 | 25 | 8000 |
| SB | Z | 2016 Slash | 4.5 | 4.25 | 4.0 | 4.0 | -- | -- | 7.0 | 2000 | -- | -- | 1.0 | 25 | 8000 |
NFDRS Grass Fuel Model Descriptions
2016 Fuel Model V
Fuel Model A – This fuel model represents western grasslands vegetated by annual grasses and forbs. Brush or trees may be present but are very sparse, occupying less than one-third of the area. Examples of types where Fuel Model A should be used are cheatgrass and medusa head. Open pinyon-juniper, sagebrush-grass, and desert shrub associations may appropriately be assigned this fuel model if the woody plants meet the density criteria. The quantity and continuity of the ground fuels vary greatly with rainfall from year to year.
Fuel Model L – This fuel model is meant to represent western grasslands vegetated by perennial grasses. The principal species are coarser and the loadings heavier than those in Model A fuels. Otherwise, the situations are very similar; shrubs and trees occupy less than one-third of the area. The quantity of fuels in these areas is more stable from year to year. In sagebrush areas Fuel Model T may be more appropriate.
NFDRS Grass/Shrub Fuel Model Descriptions
2016 Fuel Model W
Fuel Model C – Open pine stands typify Model C fuels. Perennial grasses and forbs are the primary ground fuel, but there is enough needle litter and branch-wood present to contribute significantly to the fuel loading. Some brush and shrubs may be present but are of little consequence. Types covered by Fuel Model C are open, longleaf, slash, ponderosa, Jeffery, and sugar pine stands. Some pinyon-juniper stands may qualify.
Fuel Model D – This fuel model is specifically for the palmetto-gallberry understory-pine association of the southeast coastal plains. It can also be used for the so-called Low Pocosins where Fuel Model O might be too severe. This model should only be used in the Southeast because of the high moisture of extinction associated with it.
Fuel Model N – This fuel model was constructed specifically for the sawgrass prairies of south Florida. It may be useful in other marsh situations where the fuel is coarse and reed like. This model assumes that one-third of the aerial portion of the plants is dead. Fast-spreading, intense fires can occur over standing water.
Fuel Model S – Alaskan and alpine tundra on relatively well-drained sites fit this fuel model. Grass and low shrubs are often present, but the principal fuel is a deep layer of lichens and moss. Fires in these fuels are not fast spreading or intense but are difficult to extinguish.
Fuel Model T – The sagebrush-grass types of the Great Basin and the Intermountain West are characteristic of Fuel Model T. The shrubs burn easily and are not dense enough to shade out grass and other herbaceous plants. The shrubs must occupy at least one-third of the site or the A or L fuel models should be used. Fuel Model T might be used for immature scrub oak and desert shrub associations in the West and the scrub oak-wire grass type of the Southeast.
Timber Understory and Timber Litter Fuel Model Descriptions
2016 Fuel Model Y
Fuel Model H – Used for short-needled conifers (white pines, spruces, larches, and firs). In contrast to FM G fuels, FM H describes a healthy stand with sparse undergrowth and a thin layer of ground fuels. Fires in FM H are typically slow spreading and are dangerous only in scattered areas where the downed woody material is concentrated.
Fuel Model G – Used for dense conifer stands where there is a heavy accumulation of litter and down woody material. They are typically over mature and may be suffering insect, disease, and wind or ice damage – natural events that create a very heavy buildup of dead material on the forest floor. The duff and litter are deep and much of the woody material is more than three inches in diameter. The undergrowth is variable, but shrubs are usually restricted to openings. Types represented here are hemlock-Sitka spruce, coastal Douglas-fir, and wind thrown or bug-killed stands of lodgepole pine and spruce.
Fuel Model E – Used after leaf fall for hardwood and mixed hardwood-conifer types where the hardwoods dominate. The fuel is primarily hardwood leaf litter. It best represents the oak- hickory types and is a good choice for northern hardwoods and mixed forests of the Southeast. In high winds, the fire danger may be underrated because rolling and blowing leaves are not accounted for.
Fuel Model R – This fuel model represents hardwood areas after the canopies leaf out in the spring. It is the growing season version of FM E. It should be used during the summer in all hardwood and mixed conifer-hardwood stands where more than half of the overstory is deciduous.
Fuel Model U – This fuel model represents the closed stands of western long-needled pines. The ground fuels are primarily litter and small branch-wood. Grass and shrubs are precluded by the dense canopy but may occur in the occasional natural opening. Fuel Model U should be used for ponderosa, Jeffery, sugar pine stands of the West and red pine stands of the Lake States. Use FM P for southern pine plantations.
Fuel Model P – Closed, thrifty stands of long- needled southern pines are characteristic. A 2-4 inch layer of lightly compacted needle litter is the primary fuel. Some small diameter branch-wood is present but the density of the canopy precludes more than a scattering of shrubs/grass. FM P has the high moisture of extinction characteristic of the Southeast. The corresponding model for other long-needled pines is FM U.
NFDRS Brush/Shrub Fuel Model Descriptions
2016 Fuel Model X
Fuel Model B – Mature, dense fields of brush six feet or more in height is represented by this fuel model. One-fourth or more of the aerial fuel in such stands is dead. Foliage burns readily. Model B fuels are potentially very dangerous, fostering intense, fast-spreading fires. This model is for California mixed chaparral, generally 30 years or older. The F model is more appropriate for pure chamise stands. The B model may also be used for the New Jersey pine barrens.
Fuel Model O – The O fuel model applies to dense, brush like fuels of the Southeast. In contrast to B fuels, O fuels are almost entirely living except for a deep litter layer. The foliage burns readily except during the active growing season. The plants are typically over six feet tall and are often found under open stands of pine. The high pocosins of the Virginia, North and South Carolina coasts are the ideal of Fuel Model O. If the plants do not meet the six-foot criteria in those areas, Fuel Model D should be used.
Fuel Model F – Fuel Model F represents mature closed chamise stands and oak brush fields of Arizona, Utah, and Colorado. It also applies to young, closed stands and mature, open stands of California mixed chaparral. Open stands of pinyon-juniper are represented; however, fire activity will be overrated at low wind speeds and where ground fuels are sparse.
Fuel Model Q – Upland Alaska black spruce is represented by Fuel Model Q. The stands are dense but have frequent openings filled with usually flammable shrub species. The forest floor is a deep layer of moss and lichens, but there is some needle litter and small diameter branch-wood. The branches are persistent on the trees, and ground fires easily reach into the crowns. This fuel model may be useful for Jack pine stands in the Lake States. Ground fires are typically slow spreading, but a dangerous crowning potential exists. Users should be alert to such events and note those levels of SC and BI when crowning occurs.
NFDRS Slash and Blowdown Fuel Model Descriptions
2016 Fuel Model Z
Fuel Model I – Fuel Model I was designed for clear-cut conifer slash where the total loading of materials less than six inches in diameter exceeds 25 tons/acre. After the slash settles, and the fines (needles and twigs) fall from the branches, Fuel Model I will overrate the fire potential. For lighter loadings of clear-cut conifer slash use Fuel Model J, and for light thinnings and partial cuts where the slash is scattered under a residual overstory, use Fuel Model K.
Fuel Model J – This model complements Fuel Model I. It is for clear-cuts and heavily thinned conifer stands where the total loading of material less than six inches in diameter is less than 25 tons per acre. Again as the slash ages, the fire potential will be overrated.
Model K – Slash fuels from light thinnings and partial cuts in conifer stands are represented by Fuel Model K. Typically the slash is scattered about under an open overstory. This model applies to hardwood slash and to southern pine clear-cuts where loading of all fuels is less than 15 tons/acre.
Annual vs Perennial Grass
The loading of fine fuels associated with annual grasses shifts from live to dead and stays there for the duration of the season. For perennial grasses, the shift from live to dead is much slower and may even stop or reverse if the right combinations of temperature and precipitation occur during the season.
Deciduous vs Evergreen Shrub (88 Version only)
In the 1988 revision to the NFDRS, separate equations were developed for deciduous and evergreen shrub vegetation, requiring users to enter a code indicating whether their local shrub vegetation is deciduous (D) or evergreen (E).
Climate Class Assumptions (78/88 Versions only)
| Climate Class | Name | Ecology | Description | Dormant FM Minimums 100 hours |
Dormant FM Minimums 1000 hours |
Dormant FM Minimums Woody | 78 Transition Rates, in days Green-up |
78 Transition Rates, in days Curing |
|---|---|---|---|---|---|---|---|---|
| 1 | Arid and Semi-Aird | Desert | Sonoran, Mohave, Short grass prairie, interior west scrub lands | 10% | 15% | 50% | 7 days | Controlled by 1000 hour fuel moisture between full green-up and dormancy |
| 2 | Sub-humid | Steppe and Savanna | AK interior, chaparral, oak and pine woodlands | 15% | 20% | 60% | 14 days |
Controlled by 1000 hour fuel moisture between full green-up and dormancy
|
| 3 | Sub-humid and humid | Savanna and Forest | Bluestem prairie, grass-oak hickory savanna, Eastern US, western forests | 20% | 25% | 70% | 21 days | Controlled by 1000 hour fuel moisture between full green-up and dormancy |
| 4 | Wet | Rain forest | Coastal forests | 25% | 30% | 80% | 28 days | Controlled by 1000 hour fuel moisture between full green-up and dormancy |
Slope Class Setting
| Slope Class | Slope Range | Effective Midpoint | Slope Coefficient |
|---|---|---|---|
| 1 | 0-25 | 22.5 | 0.267 |
| 2 | 26-40 | 31.8 | 0.533 |
| 3 | 41-55 | 44.5 | 1.068 |
| 4 | 56-75 | 63.6 | 2.134 |
| 5 | >75 | 90.0 | 4.273 |
Fire Danger: NFDRS System Inputs and Outputs
Fire Danger: NFDRS System Inputs and Outputs Anonymous (not verified)- Observations and Forecasts
- Primary System Components & Indices
- Wildland Fire Assessment System (WFAS)
- Weather Information Management System (WIMS)
- Pocket Cards
Observations and Forecasts
Fire Weather Observations are collected and maintained according to standards established in the NWCG Standards for Fire Weather Stations, PMS 426-3.
Lightning Activity Level (LAL)
| Scale | Description |
|---|---|
| LAL 1 | No Thunderstorms. |
| LAL 2 | Isolated thunderstorms. Light rain will occasionally reach the ground. Lightning is very infrequent, 1-5 cloud-to-ground strikes in a five minute period. |
| LAL 3 |
Widely scattered thunderstorms. Light to moderate rain will reach the ground. Lightning is infrequent, 6-10 cloud-to-ground strikes in a five minute period. |
| LAL 4 | Scattered thunderstorms. Moderate rain is commonly produced. Lightning is frequent, 11-15 cloud-to-ground strikes in a five minute period. |
| LAL 5 | Numerous thunderstorms. Rainfall is moderate to heavy. Lightning is frequent and intense, greater than 15 cloud-to-ground strikes in a five minute period. |
| LAL 6 | Same as LAL 3 except thunderstorms are dry (no rain reaches the ground). This type of lightning has the potential for extreme fire activity and is normally highlighted in fire weather forecasts with a Red Flag Warning. |
Primary System Components and Indices
Ignition Component (IC)
The Ignition Component is a rating of the probability that a firebrand will cause a fire requiring suppression action. Expressed as a probability; it ranges on a scale of zero to 100. An IC of 100 means that every firebrand will cause an actionable fire if it contacts a receptive fuel. Likewise, an IC of zero would mean that no firebrand would cause an actionable fire under those conditions. Note the emphasis is on action.
Spread Component (SC)
The Spread Component is a rating of the forward rate of spread of a headfire. Deeming, et al (1977), states that, “the Spread Component is numerically equal to the theoretical ideal rate of spread expressed in feet-per-minute. Highly variable from day to day, the Spread Component is expressed on an open-ended scale; thus it has no upper limit."
Energy Release Component (ERC)
The Energy Release Component is a number related to the available energy, BTU per unit area square foot, within the flaming front at the head of a fire. Daily variations in ERC are due to changes in moisture content of the various fuels present, both live and dead. Since this number represents the potential heat release per unit area in the flaming zone, it can provide guidance to several important fire activities. It may also be considered a composite fuel moisture value as it reflects the contribution that all live and dead fuels offer to potential fire intensity. It should also be pointed out that the ERC is a cumulative or build-up type of index. As live fuels cure and dead fuels dry, the ERC values get higher thus providing a good reflection of drought conditions. The scale is open-ended or unlimited and, as with other NFDRS components, is relative. Conditions producing an ERC value of 24 represent a potential heat release twice that of conditions resulting in an ERC value of 12.
As a reflection of its composite fuel moisture nature, the ERC becomes a relatively stable evaluation tool for planning decisions that might need to be made 24 to 72 hours ahead of an expected fire decision or action. Since wind does not influence the ERC calculation, the daily variation will be relatively small. The 1000 hour time lag fuel moisture (TLFM) is a primary entry into the ERC calculation through its effect on both living and dead fuel moisture inputs. There may be a tendency to use the 1000 hour TLFM as a separate index for drought considerations. A word of caution – any use of the 1000-hour TLFM as a separate index must be preceded by an analysis of historical fire weather data to identify critical levels of 1000 hour TLFM. A better tool for measurement of drought conditions is the ERC since it considers both dead and live fuel moistures.
Burning Index (BI)
The Burning Index is a number related to the contribution of fire behavior to the effort of containing a fire. The BI is derived from a combination of Spread and Energy Release Components. It is expressed as a numeric value closely related to the flame length in feet multiplied by ten. The scale is open ended which allows the range of numbers to adequately define fire problems, even in time of low to moderate fire danger. It’s important to remember that computed BI values represent the near upper limit to be expected on the rating area. In other words, if a fire occurs in the worst fuel, weather, and topography conditions of the rating area, then these numbers indicate its expected fireline intensities and flame length. Studies have indicated that difficulty of containment is not directly proportional to flame length alone but rather to fireline intensity; the rate of heat release per unit length of fireline (Byram 1959). The use of fireline intensity as a measure of difficulty shows that the containment job increases more than twice as fast as BI values increase. It is still safe to say that flame length is related to fireline intensity because BI is based on flame length.
Lightning Occurrence Index (LOI)
The Lightning Occurrence Index is a numerical rating of the potential occurrence of lightning-caused fires. It is intended to reflect the number of lightning caused fires one could expect on any given day. The Lightning Occurrence is scaled such that a LOI value of 100 represents a potential of 10 fires per million acres. It is derived from a combination of Lightning Activity Level (LAL) and Ignition Component. To effectively develop this index the user must perform an extensive analysis to develop a local relationship between thunderstorm activity level and number of actual fire starts that result. Since our ability to accurately quantify thunderstorm intensity is limited it is difficult to develop a relationship between activity and fire starts. Thus the Lightning Occurrence Index is seldom used in fire management decisions. Local fire managers should monitor the lightning activity level provided by the National Weather Service, and with a little experience can develop their own rating of lightning fire potential.
Human Caused Fire Occurrence Index (MCOI)
This is a numeric rating of the potential occurrence of human-caused fires. Similar to the Lightning Occurrence Index, this value is intended to reflect the number of human-caused fires one could expect on any given day. It is derived from a measure of daily human activity and its associated fire start potential, the human caused fire risk input, and the ignition component. The MCOI is scaled such that the number is equal to ten times the number of fires expected that day per million acres. An index value of 20 represents a potential of teo human caused fires per million acres that day if the fuel bed was receptive for ignition. The original developers of the National Fire Danger Rating System recognized that where the total fires per million acres average twenty or fewer, the evaluations are questionable. This has been validated through application. As with the Lightning Occurrence Index, the Human-caused Fire Occurrence Index requires considerable analysis to establish a local relationship between the level of human activity and fire starts. Since human activity is fairly constant throughout the season and human-caused fire occurrence in, for example, the Pacific Northwest, is relatively low in terms of fires per million acres per day, most analyses result in very low risk inputs that don’t change much from day to day. Few fire managers, if any, are using this index in making day-to-day decisions.
Fire Load Index (FLI)
Fire Load Index is a rating of the maximum effort required to contain all probable fires occurring within a rating area during the rating period. The FLI was designed to be the end product of the NFDRS – the basic preparedness or strength-of-force pre-suppression index for an administrative unit. It was to be used to set the readiness level for the unit. It focuses attention upon the total fire containment problem. Because the FLI is a composite of the various components and indexes of the NFDRS, including the local lightning and human caused fire risk inputs, the comparability of values varied significantly from one unit to another. To be useful managers must establish the relationship between the FLI calculated for their unit and the true fire containment effort needed. The FLI is represented as a number on a scale of 1-100. It provides no specific information as to the nature of the potential fire problem as individual indexes and components do. Because the Fire Load Index is a composite of several pieces of the NFDRS, its utility is impacted by of the inherent weaknesses of the individual components and indexes. Very few fire management decisions are made based on the Fire Load Index alone.
Keetch-Byram Drought Index (KBDI)
This index is not an output of the National Fire Danger Rating System itself but is often displayed by the processors used to calculate NFDRS outputs. KBDI is a stand-alone index that can be used to measure the effects of seasonal drought on fire potential. The actual numeric value of the index is an estimate of the amount of precipitation (in 100ths of inches) needed to bring the soil back to saturation (a value of zero is complete saturation of the soil). Since the index only deals with the top eight inches of the soil profile, the maximum KBDI value of 800 or 8.00 inches of precipitation would be needed to bring the soil back to saturation. The Keetch-Byram Drought Index’s relationship to fire danger is that as the index value increases, the vegetation is subjected to increased stress due to moisture deficiency. At higher values desiccation occurs and live plant material is added to the dead fuel loading on the site. Also an increasing portion of the duff/litter layer becomes available fuel at higher index values. If you are using the 1978 fuel models, KBDI values can be used in conjunction with the National Fire Danger Rating System outputs to aid decision making. If you are using the modified NFDRS fuel models that were developed in 1988, KBDI values are a required input to calculate daily NFDRS outputs. Since most fire danger stations are not being operated when the soil is in a saturated condition, it is necessary to estimate what the KBDI value is when daily observations are began. The technical documentation describing the KBDI includes methodology to estimate the initiating value and is included in the attached reference list. Most processors include a default initiation value of 100.
Wildland Fire Assessment System (WFAS)
WFAS provides public access to standard Fire Potential/Danger depictions, Fire Weather information, Fuel Moisture/Drought products, and assorted Experimental Products produced by the Rocky Mountain Research Station’s Fire, Fuel and Smoke Science Program.
Operating with fire weather observations from WIMS (4.3.4), gridded forecasts from NWS National Digital Forecast Database (NDFD), and gridded fire danger climatology dating to 1979.
Weather Information Management System (WIMS)
NAP Access Portal requires login and provides authorized access for management of RAWS station catalogs, observations, NFDRS calculations, and source data for other portals such as the Enterprise Geospatial Portal (EGP) and Wildland Fire Assessment System (WFAS).
Pocket Cards
Wildland Fire Application Information Portal (WFAIP) provides access to background, instructions, standards, and approved cards throughout the US.
The Fire Danger Pocket Card provides a format for interpreting and communicating key index values provided by the National Fire Danger Rating System. The objective is to lead to greater awareness of fire danger and subsequently increased firefighter safety. The Pocket Card provides a description of seasonal changes in fire danger in a local area. It is useful to both local and out-of-area firefighters.
The Pocket Card has very important day-to-day pre-suppression uses. When the morning and afternoon weather is read each day, the actual and predicted indices are announced. Firefighters can reference their card and assess where today falls in the range of historical values for danger-rating. This important information should be discussed at morning crew meetings, tailgate safety meetings, incident briefings, etc.
Local fire management personnel can produce the cards using Fire Family Plus. Cards should be developed locally with local fire management involvement to meet local fire management needs.
Fire Danger: Interagency Predictive Services
Fire Danger: Interagency Predictive Services Anonymous (not verified)During the active fire season, the National Interagency Coordination Center (NICC) and each geographic area predictive service office is staffed seven days a week to support the assessment needs of fire program managers, incident personnel, and groups coordinating regional fire management resources.
All the geographic area predictive service products can be referenced from the National Interagency Coordination Center (NICC) outlooks page.
A National 7-Day Significant Fire Potential Outlook is produced each day.
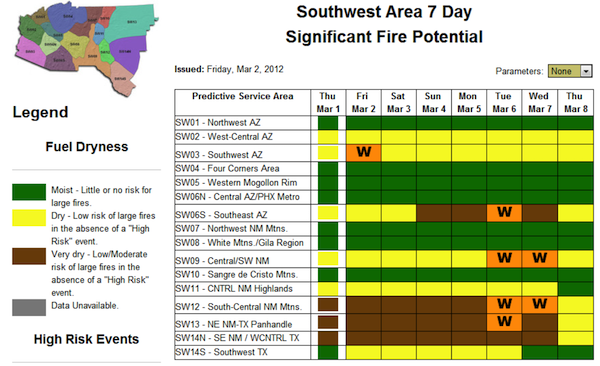
This 7-day outlook also includes forecasts for the weather elements, fuel moistures, and fire danger indices that are used to produce these potential classifications. These 7-day forecasts represent averages for areas defined by the geographic area to be climatologically distinct.
Other standard products include daily, monthly, and seasonal assessments. Several produce multi-media briefings that can be linked from the outlooks page.
Fire Danger References
Fire Danger References Anonymous (not verified)Other Fire Danger Resources
Alaska Fire Weather Index (FWI)
Florida Wildland Fire Danger Index (FDI)
Georgia Forestry Commission Fire Weather System
Great Lakes Fire Weather Index (FWI)
Michigan DNR Wildland Fire Application
Minnesota DNR Wildfire Information Center
New York State Fire Danger Map
North Carolina Fire Weather Intelligence Portal
Santa Ana Wildfire Threat Index
Drought Assessment Resources
Western Water Assessment (NOAA Regional Integrated Sciences and Assessments)
The Drought Monitor (National Drought Mitigation Center)
National Integrated Drought Information System (National Centers for Environmental Information)
National Drought Mitigation Center (University of Nebraska – Lincoln)
Fire Danger References
Online Resources
- Weather Information Management System (WIMS)
- Wildland Fire Assessment System (WFAS)
- NFDRS Pocket Cards
- US Interagency Predictive Services Outlooks
Publications
Andrews, P. L.; Bradshaw, L. S.; Bunnell, D.; and Curcio G., Fire Danger Rating PocketCard for Firefighter Safety, Symposium on Fire and Forest Meteorology, 1997.
Bradshaw, L. S.; Deeming, J. E.; Burgan, R. E.; and Cohen, J. D., The 1978 National Fire-Danger Rating System: technical documentation, U.S. Department of Agriculture, Forest Service, Intermountain Forest and Range Experiment Station; 1984.
Burgan, R. E., 1988 Revisions to the 1978 National Fire-Danger Rating System, USDA Forest Service, Southeastern Forest Experiment Station, Research Paper, 1988.
Deeming, J. E.; Burgan, R. E.; and Cohen, J. D., The National Fire-Danger Rating System – 1978, USDA Forest Service, Intermountain Forest and Range Experiment Station, 1978.
Fosberg, M. A., and Deeming, J. E., Derivation of the 1 and 10-hour timelag fuel moisture calculations for fire-danger rating, USDA Forest Service, Rocky Mountain Forest and Range Experiment Station, 1971.
Jolly, W.M.; Nemani, R.; and Running, S.W., A generalized, bioclimatic index to predict foliar phenology in response to climate, Global Change Biology, 2005.
Remote Sensing/Fire Weather Support Unit, Interagency Wildland Fire Weather Station Standards and Guidelines, PMS 426-3, National Wildfire Coordinating Group, 2014.
Nelson R.M., Jr., Prediction of diurnal change in 10-h fuel stick moisture content, Canadian Journal of Forest Research, 2000.
Schlobohm, P., and Brain, J., Gaining an Understanding of the National Fire Danger Rating System, PMS 932, National Wildfire Coordinating Group, 2002.